

MV Charts 2

وصف لـMV Charts 2
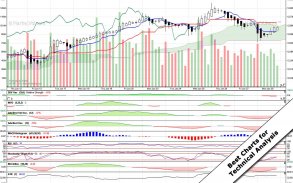
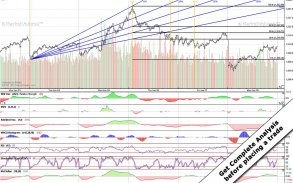
MarketVolume's charts with complete set indicators and studies for technical analysis of stocks and indexes. Technical indicators cover all aspects of technical analysis including but not limited by price analysis, volume analysis, analysis of advancing and declining issues.
With our charts you will a have access to
- more than 100 popular technical studies;
- proprietary volume based technical indicators;
- various view period, from 1-minute charts to daily, weekly and monthly;
- different views, from bars and lines to traditional candlesticks, Heikin-Ashi candlesticks;
- saving chart style, email alerts, chart drawings;
- accessing the same charts from your personal computer;
- and much more.
After you install MV Charts you will be asked to register on www.MarketVolume.com's web site to receive username and password. This application is a free mobile version of stock charts available at MarketVolume.com. If you already subscribed to any of MarketVolume's services, you may use your MarketVolume's login info to open charts.
Keywords: stock charts, charts, technical analysis, stocks, index charts, stock market, investing, trading


